
Quick Start: Want to level up your observability game? This Splunk Observability Cloud tutorial walks you through instrumenting and monitoring a PostgreSQL database using Splunk Observability Cloud, step by step. Let me show you how to get started with modern observability tools.
What Will You Learn?
- What is Splunk Observability Cloud, and why does it matter
- How to instrument a PostgreSQL database with modern observability tools
- Where to find more resources to master Splunk Observability Cloud
Splunk Observability Cloud Tutorial Basics: Getting Started
I’ll focus on a fundamental problem to simplify learning Splunk Observability Cloud, formerly known as SignalFx. There are many ways to integrate it with your applications, which can be overwhelming. To keep things clear and practical, let’s start by monitoring a PostgreSQL database. This Splunk Observability Cloud tutorial provides hands-on experience with real monitoring scenarios.
Key Facts About Splunk Observability Cloud
- It’s an operational intelligence tool designed to observe your systems.
- Offers [many alternative operational intelligence tools] on the market
- Provides a host of integrations with cloud technologies and traditional servers
- Includes a free trial to get started
When to Use Splunk Observability Cloud
Best Use Cases:
- Observing your systems, applications, infrastructure, containers, databases, and services
- Alerting on conditions that need immediate attention
- Visualizing metrics to make informed decisions
- Monitoring system health
- Troubleshooting issues in real-time
- Real-time, automated event correlation
- Incident management with automated prioritization
- Service ticketing and on-call response automation
Less Suitable Use Cases:
- Historical data reporting
- Long-term data storage
- Trend analysis
- Future event prediction
Understanding Metrics and Metadata
The Splunk Observability Cloud agent collects metrics and sends them to their servers. Here’s what you need to know about the different metric types:
Counters
Counters are straightforward metrics that only take integer values. Think of them as tally marks - like counting the number of errors that have occurred.
Cumulative Counters
These counters last for the lifetime of a process or application. For example, the number of database calls since PostgreSQL started would be a cumulative counter.
Gauges
Gauges measure values over time. The percentage of memory usage on a PostgreSQL server is a perfect example - it fluctuates, and the gauge captures that fluctuation.
Metadata
Use metadata to filter, find, and aggregate the metrics you want to chart or alert. Here’s a simple example:
environment:prodThis environment metadata lets you search by environment within Splunk Observability Cloud.
Visualizing Your Data
Charts help you visualize metrics. For instance, a memory usage chart lets you decide when to upgrade your server’s memory.
Dashboards group charts to give you the big picture. They come in three types:
- Built-In - Default dashboards for integrations like PostgreSQL
- Custom - Your custom dashboards
- User - For isolated experimentation and visualization
Setting Up Alerts
Detectors handle events, alerts, and notifications. They can trigger alerts based on conditions and even chain together - one detector can trigger additional events after firing.
Setting Up PostgreSQL Monitoring
I’ve chosen to instrument a PostgreSQL server because it’s a technology I’m comfortable with. Using familiar technologies helps me learn SignalFx more effectively.
I’ve created a container that installs the PostgreSQL server and configured it with the OpenTelemetry PostgreSQL receiver. This modern approach gives you comprehensive visibility into your database performance.
Want to know the best part? The OpenTelemetry receiver supports metrics and traces collection, giving you a complete picture of your PostgreSQL database’s behavior.
Getting Started
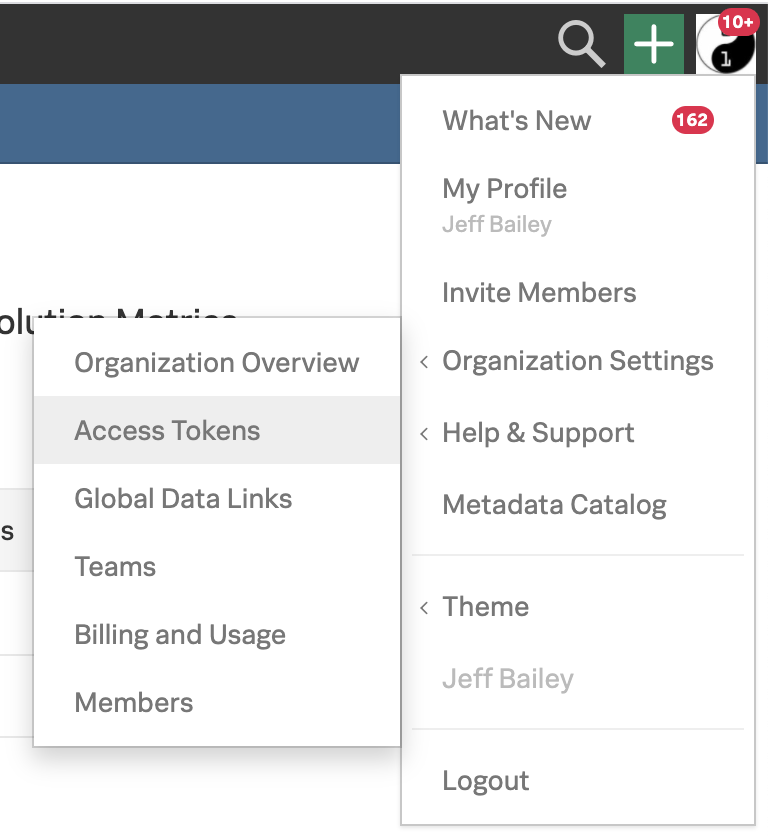
First, grab your Organization’s access token:
Profile -> Organization Settings -> Access Tokens
I configured the PostgreSQL receiver using the options from the Postgres monitor documentation. This setup gives you a solid foundation for monitoring your database.
Exploring Your Dashboards
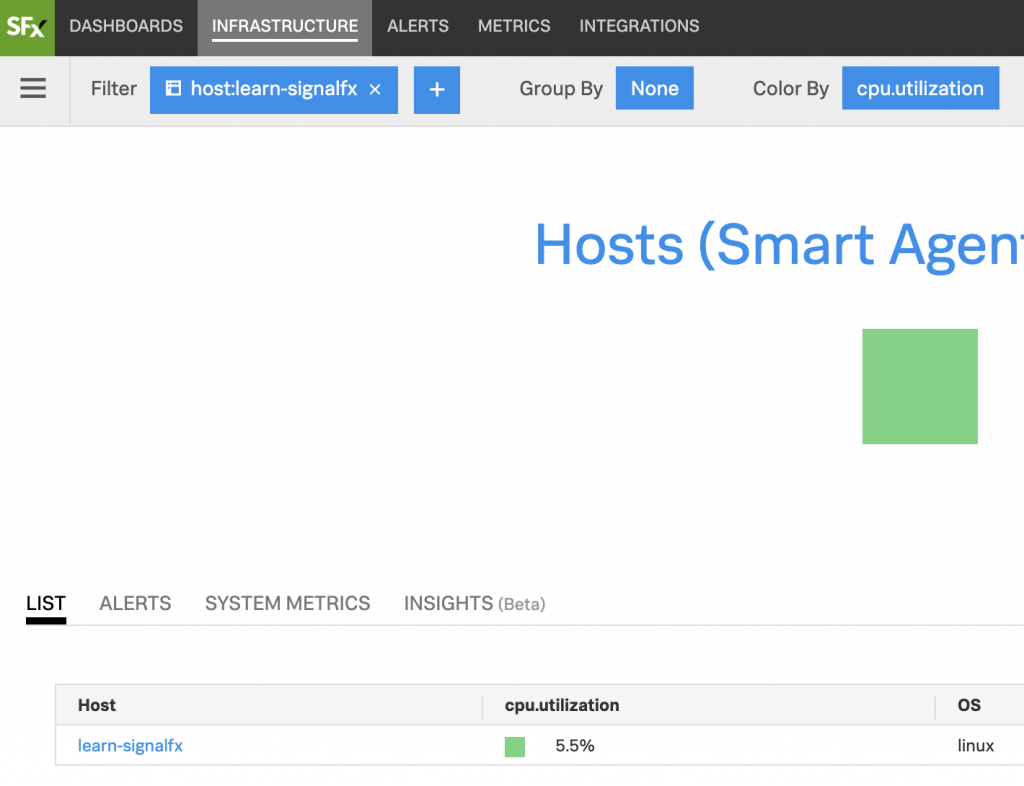
By default, every host gets its own dashboard. Once your agent runs, open Splunk Observability Cloud and click the INFRASTRUCTURE menu item.
You’ll see your host running after data reaches the Splunk Observability Cloud API:
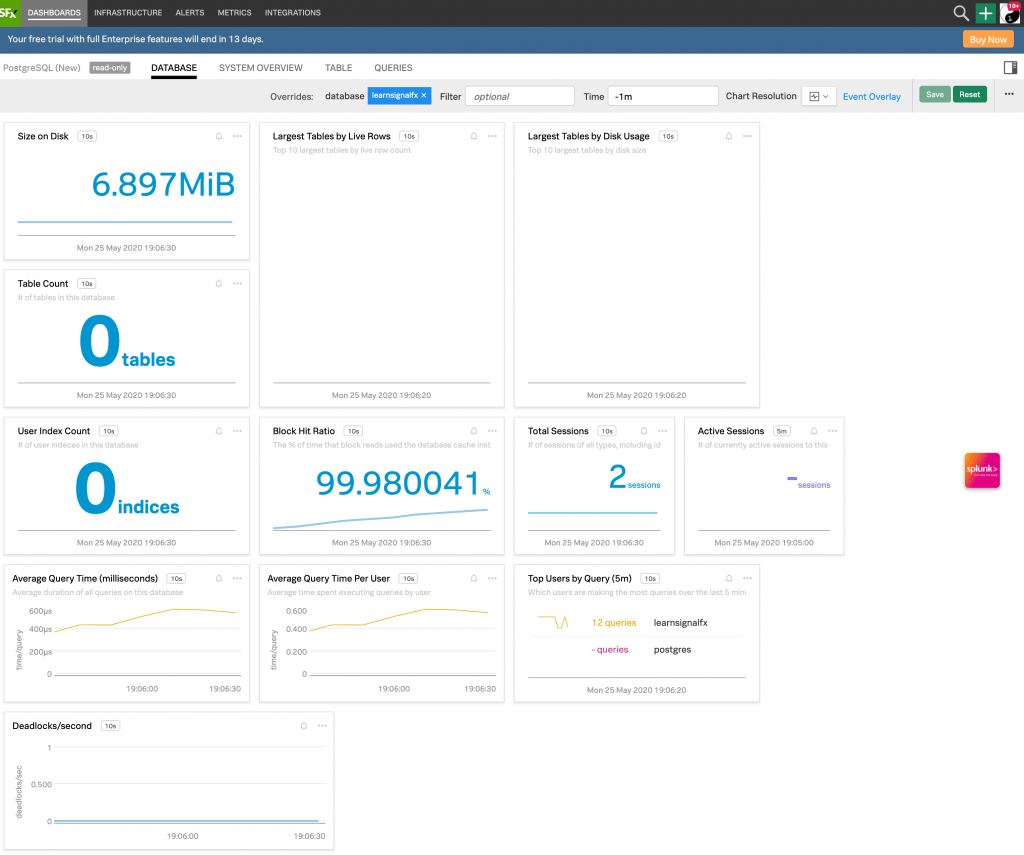
Splunk Observability Cloud also provides a dedicated PostgreSQL dashboard, giving you a comprehensive view of database-level resources:
Testing Your Setup
Let me show you how to test your monitoring setup. First, ensure you have the OpenTelemetry PostgreSQL receiver properly configured. Then, connect to your PostgreSQL container:

docker exec -it learning-signalfx /bin/bashWe’ll use pgbench to generate some load to test the monitoring setup. First, initialize the test database:
pgbench -i learnsignalfxThen run a read-only benchmark test with 4 clients and 2 threads for 10 minutes:
pgbench -c 4 -j 2 -T 600 -S learnsignalfxNote: The pgbench command is still valid and works with current PostgreSQL versions. It’s a standard benchmarking tool included with PostgreSQL installations.
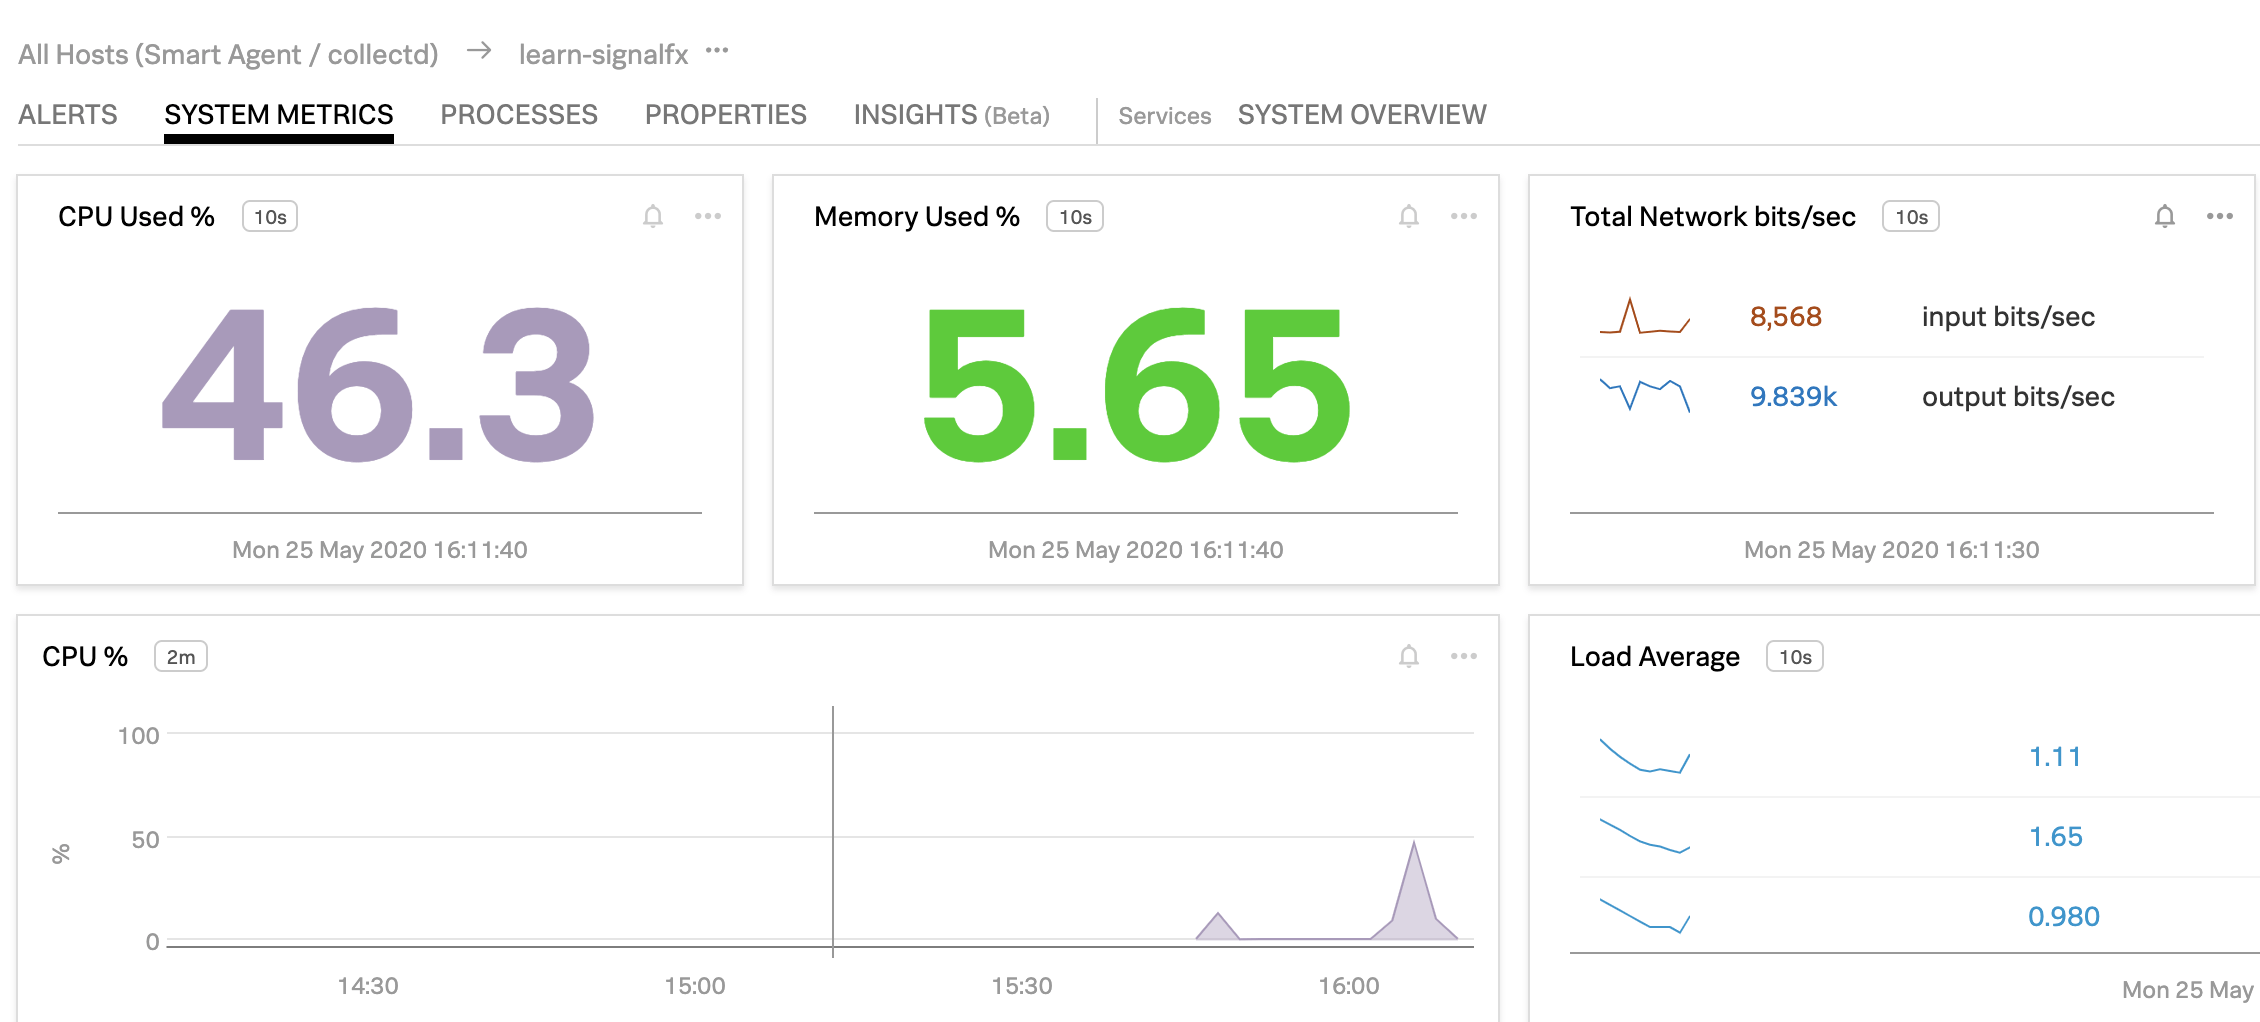
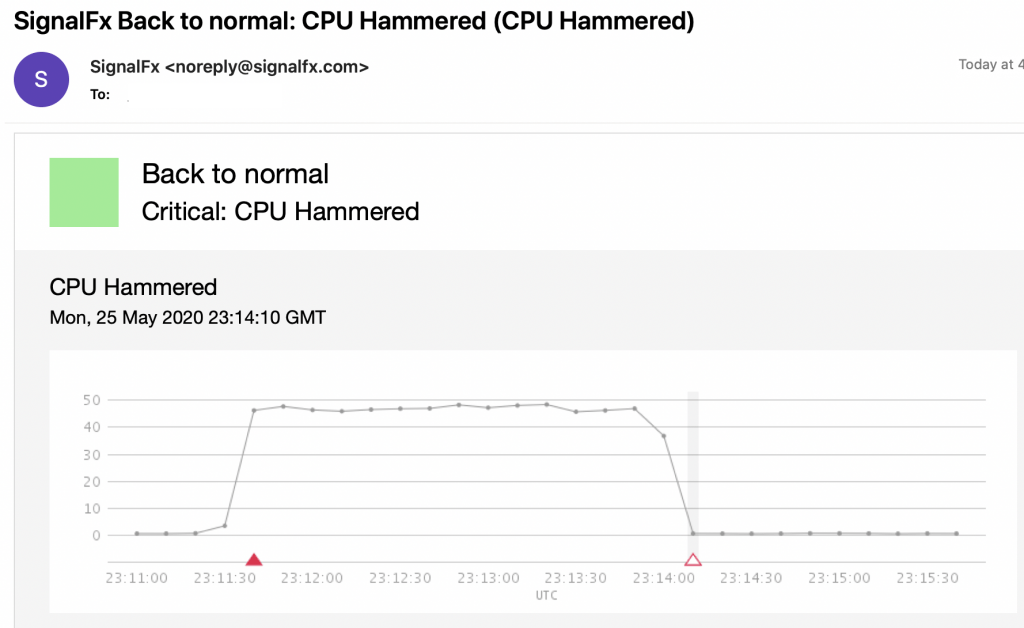
The benchmark will create a predictable CPU spike, which you can observe in the default APM dashboard:
To test alerting, create a detector for CPU utilization in the Splunk Observability Cloud interface. When you rerun the benchmark, you should see the alert trigger. After stopping the benchmark, you’ll receive a notification that the system has returned to normal:
You can experiment with different pgbench scenarios to test various aspects of your database:
- Read-write test:
pgbench -c 4 -j 2 -T 600 learnsignalfx - Custom script test:
pgbench -f custom_script.sql -c 4 -j 2 -T 600 learnsignalfx - Scale test:
pgbench -i -s 100 learnsignalfx(creates a larger test database)
These tests will help validate your monitoring setup and understand how different database workloads affect your metrics.
If you’re running on AWS EC2, check out my Splunk Observability Cloud and EC2 tutorial for detailed setup instructions.
Learn More About Splunk Observability Cloud
While books about Splunk Observability Cloud are scarce, these resources will help you master it:
- Key Documentation
- Study Material
Related Articles by Category
👁️ Monitoring
Observing system behavior to detect issues and understand performance.
👁️ Observability
Understanding system behavior through metrics, logs, and traces.
Comments #