
Quick Start: This Splunk Observability Cloud tutorial shows you how to monitor EC2 instances step-by-step. Set up comprehensive monitoring for your AWS infrastructure in under 10 minutes.
Monitoring your EC2 instances is crucial for maintaining a healthy AWS infrastructure. In this Splunk Observability Cloud tutorial, I’ll show you how to set up Splunk Observability Cloud to monitor your EC2 instances effectively. Splunk Observability Cloud (formerly SignalFx) and EC2 work together seamlessly to provide comprehensive monitoring capabilities.
Prerequisites
Before we begin, make sure you have:
- An EC2 instance running (Amazon provides a free tier for testing)
- A Splunk Observability Cloud account (you can start with a 14-day trial on Splunk’s trial page)
Step-by-Step Setup
1. Access Splunk Observability Cloud Integration
First, log into your Splunk Observability Cloud account and navigate to the INTEGRATIONS menu.
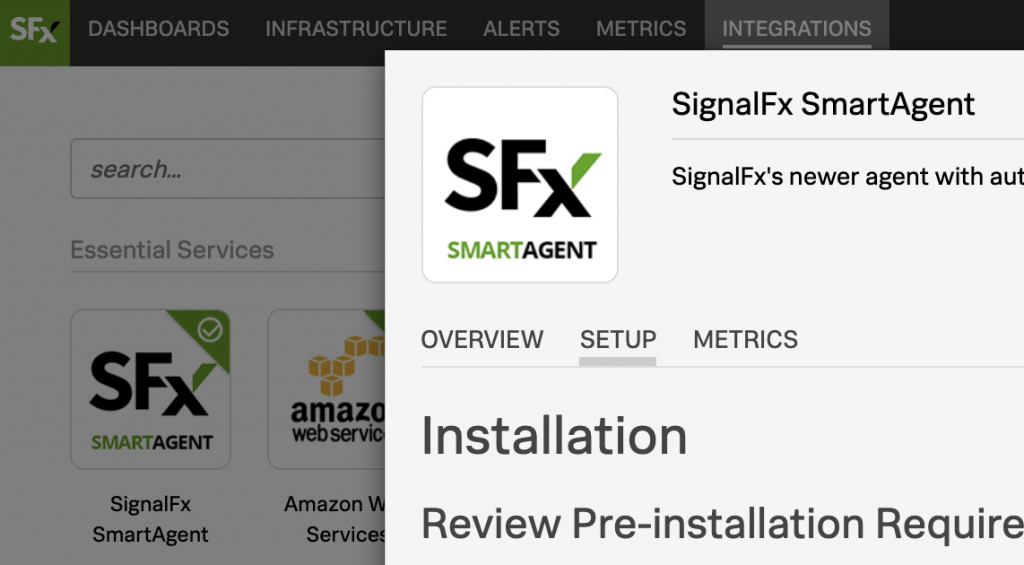
2. Configure Smart Agent
Click on the SFx SMARTAGENT icon, then select the SETUP tab. Follow the installation instructions provided.
3. View Infrastructure
Once configured, head to the INFRASTRUCTURE tab to see your monitored resources.
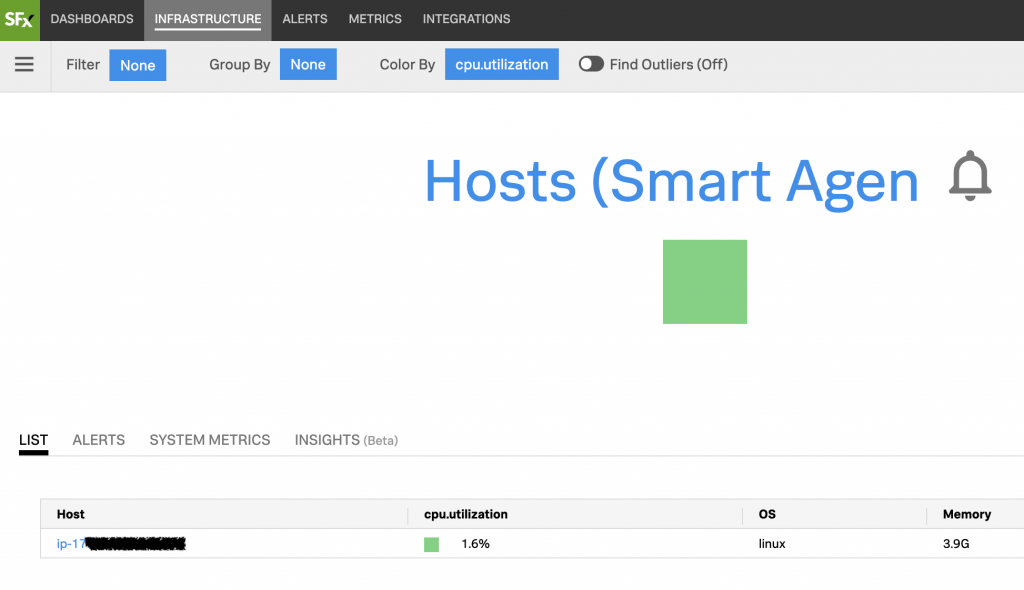
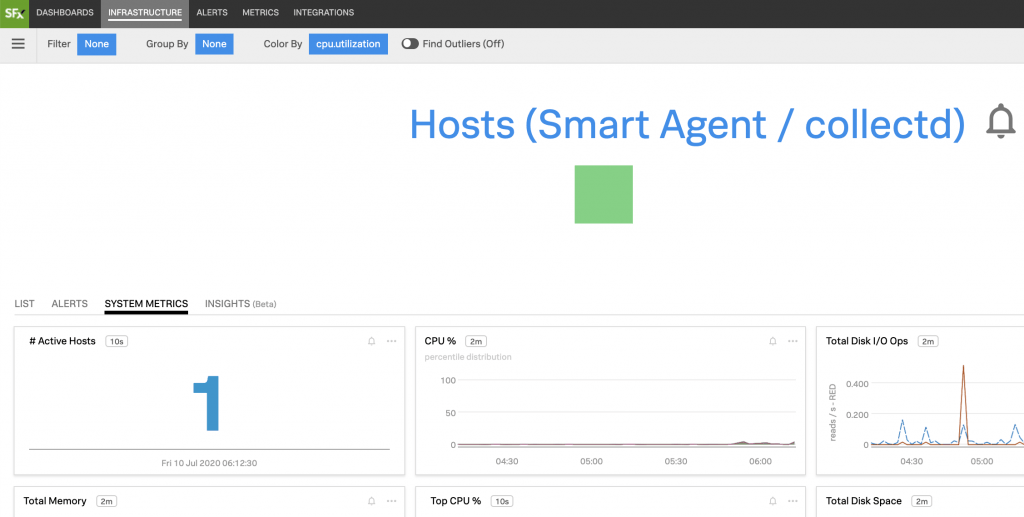
4. Monitor EC2 Metrics
Click on any host to view detailed resource utilization metrics for your EC2 instance.
Next Steps
Now that you have Splunk Observability Cloud monitoring your EC2 instances, you can:
- Set up alerts for critical metrics
- Create custom dashboards
- Monitor application performance
- Track resource utilization
Comments #