
The pattern
The team is three weeks away from shipping. The demo went well. Estimates are tight. Velocity is trending up. The product manager is drafting the launch email.
Then the integration tests hit, the third-party API rate-limits at production volume, a database query takes four seconds instead of two, a security review finds an authentication gap, and the analytics team sees a schema mismatch.
Three weeks become three months.
This pattern occurs in almost every significant project. The cone of uncertainty suggests confidence grows as a project advances, which is sometimes true. More often, project risk resembles an hourglass: uncertainty decreases during design and early build, then resets at integration and launch.
This explains each shape, its origins, and how to identify which one a project follows. It notes that generative AI usually worsens both curves.
What the cone of uncertainty says
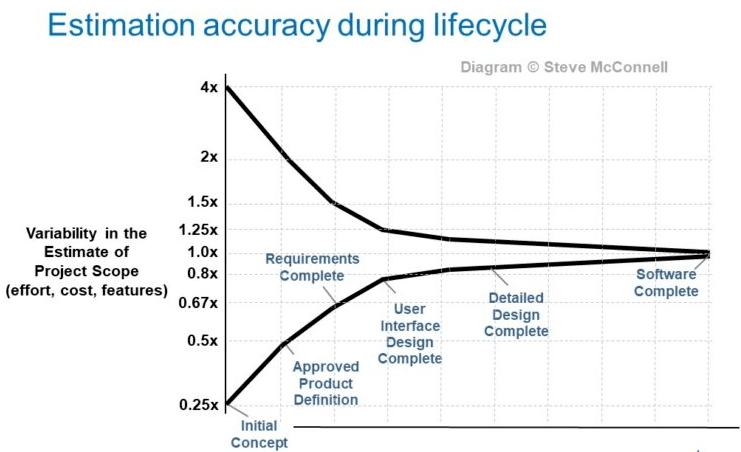
The cone of uncertainty illustrates how accuracy improves over the course of a project. Estimates may be off by a factor of four early on when little is known. As the project advances through requirements, design, and implementation, the range narrows toward delivery.
The cone indicates project variability, not just an estimate, covering remaining uncertainty. McConnell cites two sources: Unknowns, such as data shape, API quirks, and customer needs; and Variability, the natural spread in performance. Developers solving the same problem vary their solutions by about 10x in code volume.
Two corollaries follow. First, the cone is a ceiling, not a guarantee of accuracy. McConnell describes it as the best a skilled estimator can achieve at each phase. Doing worse is easy; doing better is luck. Second, more time on the estimate can’t shrink the cone. Accuracy depends on project definition, not effort. Asking for another week to refine the number changes nothing; spending a week narrowing the project definition changes everything.
The estimate bounds sweep inward over time, forming a cone at delivery.
Knowledge grows, decisions accumulate, options collapse, and plausible outcomes shrink.
A brief history
In 1981, Barry Boehm set out to measure how wrong software estimates really are at each stage of a project. His book Software Engineering Economics answered with a chart. Early on, when little is known, estimates can be off by a factor of four: a project pitched at a million dollars might actually land anywhere from $250,000 to $4 million. By the time the team has finished detailed design, that range tightens to about 1.25x. Boehm called the shape a funnel curve and noted it showed what disciplined teams could achieve, not what every team did.
Steve McConnell renamed the idea the “cone of uncertainty” in Rapid Development (1996) and refined it in Software Estimation (2006). His key addition was a condition: the cone narrows only when the team is actively reducing uncertainty. Without decisions, requirements, and validation work, it stays wide open.
Most of the narrowing happens in the first 20 to 30 percent of the project, when it happens at all. The strongest force is exclusion, deciding what the project will not do. Each “no” (a feature dropped, a platform deferred, a user segment postponed) cuts a whole branch off the tree of possible work, while each “yes” only tightens one branch. Every defining act, from a product vision to an approved UI, tightens the cone the same way. Reopening the product definition later swings it back open.
The cone is the default mental model for software estimation. It appears in project management training, agile coaching, engineering textbooks, and any executive slide where a slipping date needs explaining.
Why the cone is useful day to day
The cone is more than a project chart; it’s a personal mental model that influences a developer’s daily decisions about what to work on, commit to, and resist.
Picking the next task. When a backlog mixes unknown-heavy tasks (new integration, data model, library) with known-heavy tasks (UI tweak, refactor, copy change), the cone favors the unknown-heavy work first. Resolving unknowns reduces the cone; known work leaves it unchanged. A week spent on a spike that dismisses three options impacts the schedule more than a week shipping confident features. Firing a tracer bullet, the thin end-to-end slice from The Pragmatic Programmer, is a particularly high-leverage way to do this. Building one skeleton path through every layer of the system surfaces the integration, data, and operational questions that would otherwise wait until launch. At the same time, they’re still cheap to answer and still narrow the cone rather than widening it post-flip.
Framing estimates. The cone allows a developer to give a range like “between two days and two weeks” early, then “three days, plus or minus a day” later, and defend it as professional. The range is the estimate. Collapsing it to a single number before narrowing is the real error.
Reading design reviews. Every design review decision either narrows (selecting a database, dropping features) or widens (adding options, deferring, introducing plugins) the project’s scope. Developers tracking these changes can identify when the team votes to make the project less predictable.
Sharpening standups. “What unknown did I resolve yesterday?” is a better standup prompt than “What did I do yesterday?” because it focuses on reducing uncertainty, helping teams notice when work becomes busywork instead of progress."
Pushing back on premature commitments. A stakeholder asking for a firm date at the wide end of the cone is requesting a guess presented as a promise. The cone provides the developer with a reference: the range, the decision points that narrow it, and the date, which becomes a commitment once those are resolved. This shifts the debate from negotiation to sequencing.
Choosing what to write down. Architecture decision records, design docs, and spike write-ups keep a narrow focus. Without them, an issue resolved on Tuesday can reopen on Friday when new team members join. They transform documentation from a chore into a scheduling tool.
The cone redefines daily software work as reducing uncertainty, not just producing features. A team that ships many features without narrowing the cone remains at the wide end. One that ships fewer but eliminates more unknowns is closer to a credible date.
Where the cone breaks
The cone has two problems in practice.
McConnell notes that the cone narrows only when teams reduce uncertainty; many mistake it as automatic, assuming confidence grows over time, turning the curve into a forecast rather than a measurement.
McConnell has a name for what happens when the cone fails to narrow: the cloud of uncertainty. The classic symptom is a team stuck in “three weeks from completion” for six to twelve months. Teams avoid tackling variability, so the cone never closes, and the cloud persists. McConnell states that the cloud appears as often as the cone does, since teams skip the decisions needed to narrow it down.
The second, larger problem is that even when teams convert the cloud back into a cone, the cone ignores what occurs after detailed design. McConnell’s curve ends at “construction complete” and 1.0x, but real projects continue with integration, load testing, production, security reviews, and real users.
The phase between feature-complete and stable-in-production is when most projects fall off schedule. The cone has no opinion. The model assumes that, with detailed design, major unknowns are resolved, but experienced developers know they often arrive in the last 20 percent.
The hourglass of uncertainty
The hourglass of uncertainty is an alternative mental model. It includes the front half of the cone (knowledge from design to approval) and the missing back half (uncertainty re-expands during integration, production, and testing).

The diagram shows the same hourglass at three points in a project. At the beginning, the top bulb is full, holding all the unknown work that lies ahead. By code-complete, the sand has run through and sits in the bottom bulb: the team looks done, and confidence peaks. Then shipping to production flips the hourglass. A fresh top layer of sand begins draining during user acceptance testing, revealing uncertainty that real conditions, real load, and real users surface after the build looks finished.
The hourglass shows the cone isn’t wrong; it covers the first drain and stops. Projects slow during the second drain, yet the standard mental model ignores this, giving it no shape, name, or place on the chart.
Why the hourglass flips
Several forces flip the hourglass after code-complete, all of them predictable.
Integration surfaces hidden interdependencies. Components working alone interact unexpectedly once their technical dependencies meet. A service that depends on three others inherits their latency, failures, and outages. Hofstadter’s Law applies: it always takes longer than expected, even when you expect it.
Real data behaves differently from test data. Test fixtures are clean and small, but production data is dirty, large, and lumpy. The 80/20 rule that sped up staging becomes the 99/1 rule, hindering production. A query plan suitable for thousands of rows may choose a different index for hundreds of millions of rows.
The last 20 percent contains the hard 80 percent. Tom Cargill’s 90/90 rule, from Jon Bentley’s Programming Pearls, states: 90% of code takes 90% of development, and the last 10% consumes the remaining 90%. Teams hit this realization at the false ‘done’, right before the hourglass flips.
Edge cases multiply at the boundary. Internationalization, timezone handling, accessibility, error recovery, retries, idempotency, partial failure: seem minor but become critical under production traffic.
Architectural debt comes due at scale. Deferring a decision early is cheap but costly to revisit later, as foundational changes become more expensive than minor adjustments. By then, the entire structure depends on that foundation, and strategic drift has hardened into architecture.
Stakeholder coordination cost spikes at launch. Marketing, support, sales, legal, security, and operations are stakeholders that each need a system hook. Each adds a constraint that the engineering plan missed. Conway’s Law also appears: late integration issues mirror communication gaps in the org chart.
Public commitments land just before the flip. McConnell notes that businesses prefer to be wrong rather than vague, favoring a firm date they can revise over no commitment. Without governance that distinguishes a confidence peak from a confidence floor, this rational preference often leads to public commitments made at false peaks (such as code completion or demo success). When the hourglass flips and confidence drops, the cost extends beyond engineering to reputation.
Add these forces, and the cone reverses. The project that felt 90% sure at code-complete now feels 50% sure at launch, minus two weeks.
How to tell which shape you are in
The cone and hourglass represent different types of work, and a project can switch between them midway.
The cone fits when work is well-bounded, the problem is familiar, interdependencies are limited, and the operation is solved. A new feature in a mature product, developed by a team experienced with similar features, also follows the cone. Uncertainty decreases, velocity becomes predictable, and surprises at project end are fewer.
The hourglass suits novel work, dense interdependencies, unsolved issues, or dependencies outside the team’s control. New products, platform migrations, multi-team programs, or features involving data, payments, identity, or regulation tend to flip the hourglass at launch.
A simple diagnostic helps locate a project on the curve. Ask three questions at code-complete.
- Has the system handled production-scale data on production-equivalent infrastructure?
- Have the interdependencies it relies on been tested under failure?
- Have the stakeholders who will operate, sell, or support it sign off on the actual behavior, not the demo?
Three yeses means the cone is closing. Anything less means the hourglass is opening.
How AI changes the cone
Generative coding assistants compress the first drain of the hourglass and the early part of the cone. Building a service, drafting a schema, sketching an interface, and exploring a library all take hours instead of weeks. The initial project phases seem faster, and often are.
The risk is the illusion that compressed time resolves uncertainty. Existing code isn’t the same as working code. An afternoon-generated prototype is a useful learning tool, not evidence that the cone has closed. The unknowns the cone should resolve, like architectural decisions, data shape, failure modes, and operational constraints, are mostly deferred, not eliminated.
The cone of uncertainty should narrow with deliberate decisions. AI speeds artifact creation, not decision-making. A project can produce a lot of code in a week and remain at the wide end of the cone if the team makes no decisions about the system.
How AI changes the hourglass
The second drain of the hourglass tends to take longer when AI is in the loop.
More code, more surface. AI-assisted teams write more code quickly. Each line can cause bugs, performance issues, or security gaps. Increased code volume, made cheap by AI, adds sand to the post-flip drain.
Deferred understanding compounds late. When a human writes a function, they have a mental model of why it works. When a model writes it, and a human approves, that mental model is only partial. Deep models are needed for late debugging. Shallow models are more costly to deepen later.
Architectural drift toward the average. AI-generated code mirrors its training data, with public patterns prevailing and project-specific ones fading. It looks reasonable on its own, but behaves strangely at the seams, widening the gap.
False precision in estimates. Confidence is easy to fake when output is fast. A team that ships a feature a day feels three weeks ahead until integration, performance, and production hit the same week. With AI, the false ‘done’ arrives sooner, and the second drain hits harder.
AI changes the shape of the hourglass, not its presence. The first drain finishes faster, the false ‘done’ arrives sooner, and the second drain often takes longer because forces that re-expand uncertainty at project end also act on faster, less-understood code early on.
The discipline that closes the cone (deliberate decisions, validated assumptions, real conditions) is the same discipline that shortens the second drain. AI reshapes that discipline; it does not replace it.
Common misconceptions
“The cone of uncertainty is wrong.” The cone is incomplete; it accurately models the front half of a project’s risk curve when teams reduce uncertainty, but it offers no insight into post-detailed-design phases.
“The hourglass is just pessimism.” The hourglass is descriptive, not pessimistic. It names a risk phase that the cone leaves unnamed, making it easier to plan, budget, and explain to stakeholders.
“Agile fixes the hourglass.” Iterative delivery promotes earlier, more frequent integration, pulling the flip earlier without eliminating it. Even agile projects encounter system release to real production data, users, and operations.
“More testing closes the hourglass.” Tests identify known failure modes. The second drain concerns unknowns: load behaviors, environment, partners, and real-world traffic. Testing shortens the second drain but doesn’t eliminate it.
“Senior teams do not experience the hourglass.” Senior teams have a shorter second drain because they predict more post-flip risks and plan accordingly, but they still experience the flip. Teams claiming otherwise are often mid-project on unlaunched systems.
Conclusion
The cone of uncertainty is a useful model for the front half of a project. The hourglass of uncertainty extends through launch and early production, during which most projects miss their schedules.
Two practical takeaways follow.
First, locate the project on the curve. If interdependencies are limited and the story is solved, the cone is correct. If either is open, expect the hourglass to flip and budget for the second drain before code-complete.
Second, watch for false peak confidence at code-complete when the demo and velocity charts look good. This is the moment the hourglass looks empty and gets flipped, when teams often commit to a date that later proves invalid.
AI tooling amplifies the effect: the first drain compresses, seeming like progress; the second drain takes longer because more code, shallower understanding, and faster decisions increase post-flip risk.
The cone is a forecast; the hourglass is a map. Knowing which one a project is on distinguishes between a launch and a slip.
Where to go next
Related explanation reading:
- What Is Conway’s Law? for why the late-stage coordination spike in the second drain usually traces back to the org chart.
- Fundamentals of Program Management for the dependency management, stakeholder coordination, and governance disciplines that shorten the second drain when multiple projects ship together.
- Fundamentals of Software Project Management for the broader frame, the cone and the hourglass sit inside: scope, time, cost, risk, and the lifecycle phases the two drains map onto.
External reading:
- Steve McConnell’s Software Estimation: Demystifying the Black Art covers the cone in detail, including the warning that the cone narrows only with deliberate effort.
- Tom DeMarco and Tim Lister’s Waltzing With Bears treats project risk as something to model explicitly rather than assume away.
- Jon Bentley’s Programming Pearls introduces the 90/90 rule, which describes the second drain of the hourglass before the hourglass had a name.
References
- Software Engineering Economics, Barry Boehm’s 1981 book that introduced the funnel curve of estimate accuracy across project phases.
- Cone of Uncertainty, Construx’s reference page on Steve McConnell’s treatment of the cone, covering the unknowns versus variability distinction, the cloud of uncertainty failure mode, the prospect-not-promise framing, and how the cone interacts with the business commitment process on traditional and agile projects.
- Rapid Development, Steve McConnell’s 1996 book, where the term “cone of uncertainty” first appeared.
- Software Estimation: Demystifying the Black Art, Steve McConnell’s 2006 follow-up that revisits and refines the cone with field data.
- The Cone of Uncertainty (PDF), Steve McConnell’s article reproducing the cone diagram and explaining why it narrows only with deliberate uncertainty-reduction work.
- Programming Pearls, Jon Bentley’s book, popularized Tom Cargill’s 90/90 rule, which describes the disproportionate cost of the final 10 percent of code.
Comments #